
Page 26 - a.hartrodt Business Report 2020 EN
P. 26
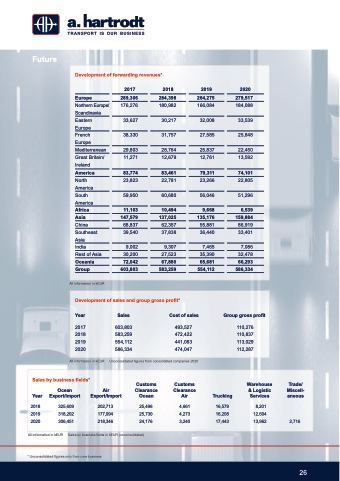
                                  Future
 Development of forwarding revenues* 2017
   2018 2019 Europe 289,306         284,398 264,275
2020 279,517
184,088
33,539
25,848
22,450 13,592
74,101
22,805
51,296
6,539 159,884 86,919 33,401
7,086 32,478 66,293
586,334
           Northern Europe/ Scandinavia Eastern
Europe
176,276
33,627
38,330
29,803   28,764 25,837
   French
Europe
Mediterranean
Great Britain/
Ireland
America
North
America
South
America
Africa 11,103     10,494 9,668 Asia 147,579       137,025 135,176 China 68,837   62,357 55,881 Southeast 39,540   37,838 36,440 Asia
India 9,002   9,307 7,465
             All information in kEUR
11,271
12,679 12,761
      83,774     83,461 79,311
     23,823   22,781 23,266
   All information in kEUR Unconsolidated figures from consolidated companies 2020
All information in kEUR Sales by business fields in kEUR (unconsolidated)
180,982 166,084 30,217 32,008 31,757 27,585
               59,950
60,680 56,046
                                Rest of Asia 30,200
27,523 35,390
     Oceania 72,042       67,880     65,681 Group 603,803           583,259         554,112
     Development of sales and group gross profit*
Year Sales
2017 603,803
2018 583,259
2019 554,112
2020 586,334
Cost of sales
493,527 472,422 441,083 474,047
Group gross profit
110,276 110,837 113,029 112,287
 Sales by business fields*
Customs Clearance Ocean
25,496 25,730 24,176
Customs Clearance Air
4,661 4,273 3,240
Warehouse & Logistic Services
8,201 12,604 13,962
Trade/ Miscell- aneous
2,716
Year
2018 2019 2020
Ocean Export/Import
325,609 318,202 306,451
Air Export/Import
202,713 177,094 218,346
Trucking
16,579 16,208 17,443
 * Unconsolidated figures only from core business
 26
